

STRATEGIC HARDWARE POSITIONING
The contemporary enterprise data center stands at a critical inflection point regarding storage infrastructure. The selection between Solid-State Drives (SSD) and Hard Disk Drives (HDD) transcends mere capacity and cost considerations; it fundamentally dictates application performance, operational continuity, and total cost of ownership (TCO) over a five-year lifecycle. This report provides a comprehensive, data-driven evaluation of enterprise-grade SSD and HDD reliability, serving as a definitive guide for infrastructure architects and procurement specialists. It meticulously dissects the inherent design philosophies, operational stressors, and failure characteristics of each technology, empowering stakeholders to make strategically aligned investment decisions.

HIGH-AVAILABILITY REDUNDANCY & RELIABILITY METRICS
Enterprise storage reliability is quantified through a spectrum of standardized metrics. The most critical of these is the Annualized Failure Rate (AFR), which projects the percentage of drives expected to fail within a single year of operation. Historically, enterprise SSDs demonstrate a superior AFR, typically ranging from 0.2% to 0.5%, compared to enterprise HDDs, which generally exhibit an AFR of 0.7% to 1.5%. However, this headline figure requires deeper analysis. The Mean Time Between Failures (MTBF) for enterprise SSDs often exceeds 2.5 million hours, while comparable HDDs are rated between 1.2 and 1.5 million hours. It is crucial to note that MTBF is a statistical projection and not a guarantee of operational lifespan. More significantly, the failure mode differs drastically: HDD failures are often gradual, preceded by measurable indicators such as increasing reallocated sector counts and spin-up retries, whereas SSDs, particularly those utilizing NAND flash, can experience sudden, catastrophic failure modes, often linked to write endurance exhaustion or controller firmware anomalies. Therefore, a holistic reliability strategy must encompass not only raw failure rates but also predictive failure analysis and robust data protection mechanisms like RAID and erasure coding. Enterprise-class SSDs incorporate advanced features such as power-loss protection (PLP) to ensure data-in-flight is committed to persistent storage during unexpected outages, a critical differentiator for transaction-heavy databases and mission-critical applications. Additionally, the total write endurance, expressed as Drive Writes Per Day (DWPD) or Terabytes Written (TBW), is a defining parameter for SSDs, dictating their suitability for write-intensive workloads and directly influencing their useful operational lifespan.
PROTOCOL INTEROPERABILITY & ECOSYSTEM INTERACTION
The integration of storage devices into the broader enterprise ecosystem hinges on protocol support and interface compatibility. The current landscape is dominated by NVMe (Non-Volatile Memory Express) for SSDs, offering a high-performance, low-latency path to the CPU via PCIe (Peripheral Component Interconnect Express) lanes. This has revolutionized storage performance, reducing latency to sub-100 microseconds and enabling massive parallelism. In contrast, enterprise HDDs primarily leverage SAS (Serial Attached SCSI) and SATA (Serial ATA) interfaces. While SAS offers superior performance and dual-port capabilities for high-availability configurations, it fundamentally operates on a legacy protocol optimized for rotational media. This distinction is paramount for interoperability; modern hyper-converged infrastructure (HCI) and all-flash arrays are designed from the ground up for NVMe, whereas legacy systems and high-capacity nearline storage archives continue to rely on the ubiquitous SATA/SAS ecosystem. The decision framework must therefore consider the existing infrastructure: Is the organization prepared to invest in a PCIe Gen 4 or Gen 5 fabric to unlock SSD potential, or does the application demand a more gradual evolution, leveraging the proven but bandwidth-limited SATA/SAS backbone? Furthermore, the industry is witnessing the emergence of NVMe-oF (NVMe over Fabrics), which extends the NVMe protocol across network fabrics like Ethernet and InfiniBand, creating a unified, high-speed storage fabric that blurs the lines between local and networked storage. This strategic interoperability is redefining storage architecture, facilitating disaggregated storage pools that can be dynamically allocated to compute resources, significantly enhancing resource utilization and scalability. Conversely, HDDs are increasingly relegated to a tiered storage architecture, serving as the deep archive tier where sheer capacity and cost efficiency outweigh performance demands, often interfacing via SATA to minimize system complexity and cost.
DETAILED PARAMETERS & PERFORMANCE SPECS
A comprehensive technical evaluation requires a granular analysis of performance parameters. The following table delineates the critical specifications for leading enterprise-grade SSDs and HDDs in the 2.5-inch small form factor (SFF) and 3.5-inch large form factor (LFF) form factors.
| Parameter | Enterprise NVMe SSD | Enterprise SAS SSD | Enterprise SATA HDD | Enterprise SAS HDD |
|---|---|---|---|---|
| Form Factor | U.2 (2.5-inch), EDSFF E3.x | 2.5-inch SFF | 3.5-inch LFF, 2.5-inch SFF | 3.5-inch LFF, 2.5-inch SFF |
| Interface Protocol | PCIe 4.0/5.0 x4, NVMe | 12Gb/s SAS | 6Gb/s SATA, 12Gb/s SAS | 12Gb/s SAS, 22Gb/s (future) |
| Sequential Read/Write | Up to 14,000 / 10,000 MB/s | Up to 2,200 / 1,800 MB/s | Up to 290 / 290 MB/s | Up to 305 / 305 MB/s |
| Random Read/Write (4K) | > 2,800,000 / 800,000 IOPS | > 400,000 / 100,000 IOPS | ~ 250 / 250 IOPS | ~ 300 / 300 IOPS |
| Typical Active Read/Write (W) | ~ 15 – 25 / 25 – 35 W | ~ 8 – 12 / 12 – 18 W | ~ 6 – 9 / 6 – 9 W | ~ 9 – 14 / 9 – 14 W |
| MTBF (Million Hours) | 2.5 | 2.0 | 1.2 | 1.5 |
| Annualized Failure Rate (AFR) | 0.35% | 0.5% | 1.0% | 0.8% |
| Reliability Feature | End-to-end Data Protection, PLP | End-to-end Data Protection, PLP | Sector-level ECC | Dual-port, Sector-level ECC |
| Primary Use Case | AI/ML, OLTP, Real-time Analytics | High-Performance Computing, DB | Cold Storage, Backup Archive | Nearline Storage, Bulk Data |
| Compliance Standards | SFF-TA-1001, OCP Datacenter | SFF-8485, SCSI SAS | SATA-IO, ATA/ATAPI | SCSI SAS, SFF-8485 |
LIFECYCLE ASSURANCE (MTBF) AND TOTAL COST OF OWNERSHIP
The Total Cost of Ownership (TCO) analysis for enterprise storage extends beyond the initial procurement cost to encompass power consumption, cooling, maintenance, and the cost of downtime. While the cost-per-gigabyte for SSDs remains significantly higher than for HDDs, the operational expenditure (OPEX) profile tells a different story. A single high-performance SSD can replace a rack of spinning disks, dramatically reducing floor space, power draw, and cooling requirements. In a typical 1,000-drive deployment, the energy savings from transitioning to an all-flash architecture can exceed 70%, yielding substantial annual savings. Moreover, the superior performance of SSDs can accelerate application response times, improve transaction throughput, and enable more efficient licensing models for per-core software, translating to tangible business value. However, the TCO equation is not universally favorable to SSDs. For cold storage, backup archives, and long-term retention where data is seldom accessed, the low cost-per-terabyte and predictable longevity of HDDs (even when powered down) present an compelling economic argument. The failure rate, while higher than SSDs, is a manageable risk in a properly architected system with RAID 6 or erasure coding and a robust spares strategy. Ultimately, the strategic imperative is to deploy storage as a tiered resource, aligning the performance and reliability characteristics of the medium with the specific service level agreements (SLAs) of the application. This is the foundation of a modern data lifecycle management strategy, ensuring that capital is optimally allocated across the performance-capacity continuum. Furthermore, the total cost of data migration, driven by the end-of-life of the storage media, is a non-trivial consideration; the longer lifecycle of HDDs in low-duty-cycle environments can delay these costly and disruptive events.
TARGET NETWORK TOPOLOGIES AND DEPLOYMENT SCHEMATIC
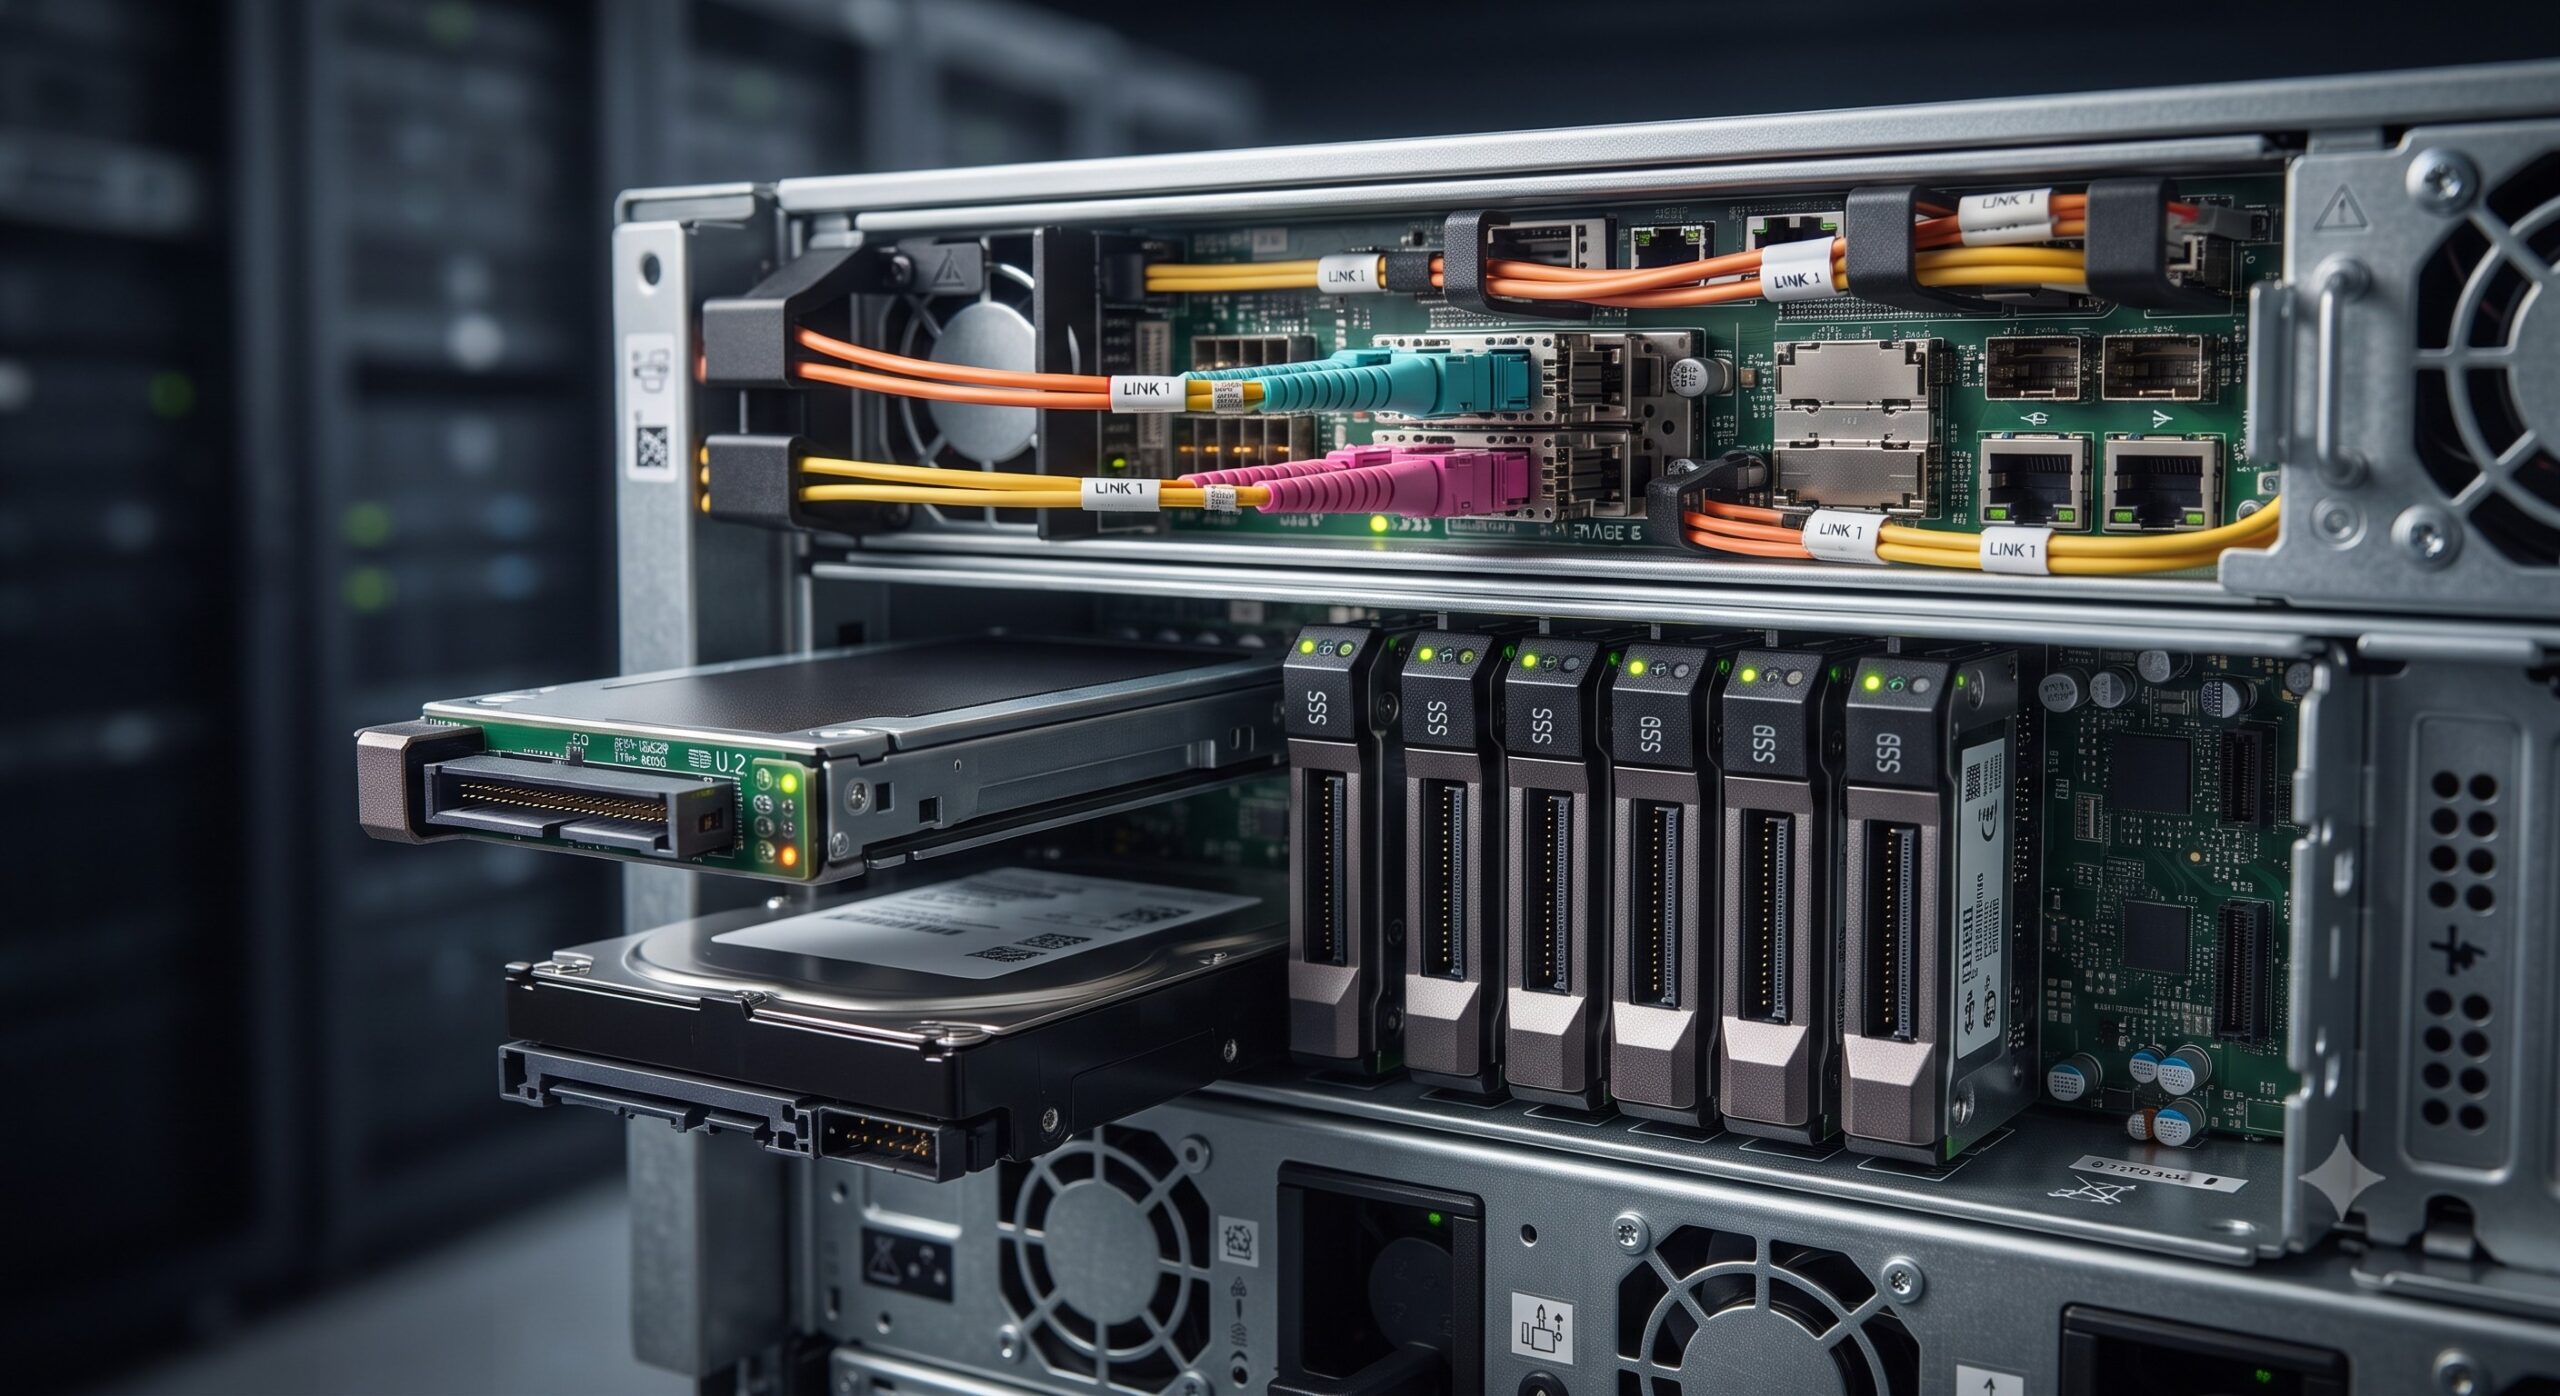
In contemporary enterprise architectures, the optimal deployment topology for SSDs and HDDs is a tiered storage hierarchy. The performance tier is an all-NVMe, or hybrid SSD/SAS, array designed to host active transactional databases, virtual desktop infrastructures (VDI), and latency-sensitive AI/ML workloads. This tier connects via high-speed, low-latency networks, typically 25GbE or 100GbE, ensuring that the storage fabric does not become a bottleneck. The HDD tier is designated for backup targets, long-term archive, and data lakes, often configured in high-density JBOD (Just a Bunch of Disks) enclosures, interfaced via 12Gb/s SAS. Data is automatically migrated between tiers based on access frequency and age, governed by policy-driven automation tools. This tiered approach maximizes the cost-benefit ratio of the storage infrastructure. The schematic below illustrates a reference design, showcasing the physical and logical integration of these storage elements within a resilient, highly available data center pod.
📥 Download Technical Specification
Click the button below to view or download the full official PDF datasheet.
Leave a comment