

Executive Overview: The Critical Role of DOM in Modern Optical Networks
In the high-stakes arena of B2B telecom infrastructure, network reliability and operational efficiency are paramount. Digital Optical Monitoring (DOM), also referred to as Digital Diagnostic Monitoring Interface (DDMI), has evolved from a value-added feature to a non-negotiable requirement for carrier-grade networks, hyperscale datacenters, and mission-critical enterprise backbones. This guide offers a comprehensive, data-driven examination of DOM technology, dissecting its internal architecture, performance metrics, deployment strategies, and its critical role in ensuring network longevity and cost-effectiveness. We move beyond surface-level definitions to provide the technical depth expected by senior network architects and procurement specialists.

1. Decoding DOM (DDMI): Core Architecture & Hardware Topology
At its heart, an optical transceiver is a complex electro-optical device. The DOM/DDMI function represents a sophisticated subsystem integrated into the transceiver’s microcontroller unit (MCU) and analog-to-digital converters (ADCs). Its primary function is real-time, in-situ monitoring of the optical and electrical parameters that define the transceiver’s operational health and signal integrity. This is not a passive monitoring system; it is an active, diagnostic layer that provides actionable telemetry to the Network Management System (NMS) via the standard I2C bus (Inter-Integrated Circuit), as defined by the SFF-8472 and SFF-8636 Multi-Source Agreements (MSAs). The hardware topology consists of several key components:
1.1. The Monitoring Subsystem Components
- Temperature Sensor: A calibrated thermistor or IC-based sensor continuously measures the transceiver’s case temperature, ensuring operation within the specified commercial (0°C to 70°C) or industrial (-40°C to 85°C) temperature ranges. Exceeding these limits, often by as little as 5°C, can lead to a 10-15% increase in Bit Error Rate (BER) and a significant reduction in lifespan.
- Supply Voltage (Vcc) Monitor: Tracks the incoming DC supply voltage, typically 3.3V ± 5%. Voltage sag or spikes can destabilize laser drivers and clock data recovery (CDR) circuits, causing link flapping and data corruption.
- Laser Bias Current Monitor: This is a direct indicator of the health of the laser diode itself. The MCU measures the current driven into the laser diode. An increase in bias current over time, while maintaining the same optical output power, is a primary indicator of laser degradation and impending failure. A 15% increase above the initial bias current often triggers a network alert.
- Transmit (Tx) Optical Power Monitor: A photodiode, typically a monitor photodiode (MPD) integrated into the laser package, samples a fraction of the output optical power. This provides real-time verification that the transceiver is transmitting at the correct power level, as specified by the IEEE 802.3 standards.
- Receive (Rx) Optical Power Monitor: This is an internal measurement of the received optical power at the transceiver’s photodiode. It is crucial for verifying that the received signal is within the receiver’s sensitivity range and overload point, guarding against input power that is either too low (causing high BER) or too high (potentially damaging the photodetector).
1.2. The Diagnostic Data Interface
This wealth of diagnostic data is made accessible through the two-wire serial interface (SCL and SDA lines). The data is formatted into specific memory map locations (A0h and A2h) and communicated to the host system. Advanced implementations, such as those aligned with the CMIS (Common Management Interface Specification) for 400G and beyond, allow for more granular, high-speed telemetry data streaming, enabling predictive analytics and AI-driven network optimization.
2. Key Performance Metrics & Data Interpretation
The value of DOM lies not just in data collection, but in its intelligent interpretation. The following table outlines the key monitored parameters, their measurement ranges, and the standard alarm/warning thresholds that are typically programmable within the transceiver’s memory. A common pitfall is ignoring the calibration coefficients stored in the EEPROM, which are essential for translating raw ADC readings into accurate, calibrated engineering units.
| Key Parameter | Measurement Range (Typical) | Alarm Threshold (Example) | Interpretation |
|---|---|---|---|
| Temperature | -40°C to +85°C | High Alarm: 75°C | Indicates insufficient cooling, potential performance degradation or failure. |
| Supply Voltage (Vcc) | 2.9V to 3.6V | Low Alarm: 3.0V, High Alarm: 3.5V | Voltage out of spec can cause unstable laser operation and link flapping. |
| Laser Bias Current | 5mA to 80mA | High Warning: 75mA | Gradual increase indicates laser aging; rapid increase points to immediate failure risk. |
| Tx Optical Power | 0dBm to +5dBm (Varies) | Low Warning: -1dBm, High Warning: +6dBm | Below lower limit causes high BER; above upper limit may damage receiver. |
| Rx Optical Power | 0dBm to -20dBm (Varies) | Low Alarm: -22dBm, High Alarm: +2dBm | Low power indicates high loss or fiber break; high power indicates overload. |
3. Operational Logic & Alerting Mechanisms (Threshold Compliance)
DOM is defined by its robust threshold-based alerting system. For each monitored parameter, the transceiver typically stores four threshold values, as defined by the SFF-8472 standard. This proactive alerting mechanism is the cornerstone of maintenance and troubleshooting efficiency, enabling a shift from reactive firefighting to predictive network maintenance.
3.1. The Four-Phase Threshold System
- Low Warning (LW): Indicates the parameter is approaching a potentially unsafe operational zone but is not yet critical. For example, a low warning on Tx power might suggest a connector with high insertion loss.
- Low Alarm (LA): The parameter has breached the minimum safe operational limit. A low alarm on Rx power signifies a potential fiber break or high link loss, placing the network at immediate risk of bit errors.
- High Warning (HW): The parameter is approaching its maximum safe limit. A high warning on temperature may trigger proactive cooling measures.
- High Alarm (HA): The parameter has exceeded the maximum safe limit. For instance, a high alarm on laser bias current is a strong early-warning sign of a failing optical subassembly (TOSA) and should trigger an immediate replacement.
3.2. Practical Application: Interpreting a Deployment Scenario
Consider a 100GBASE-LR4 transceiver deployed in a 120km link with two inline optical amplifiers. The NMS polls the transceiver’s DOM data every 30 seconds. It observes a gradual increase in laser bias current from 65mA to 74mA over 12 months, with a corresponding flat or slightly decreasing Tx power. The system triggers a high-warning alarm. This classic degradation pattern, driven by a rising Threshold Current and decreasing efficiency, allows the network operator to schedule a transceiver replacement during a maintenance window, ensuring link uptime is maintained at >99.999% (MTBF of the unit is measured at approximately 2.5 million hours at 25°C). Without DOM, this failure would manifest as a sudden link-down event, causing costly service disruptions.
4. Advanced Deployment Strategies and Network Value
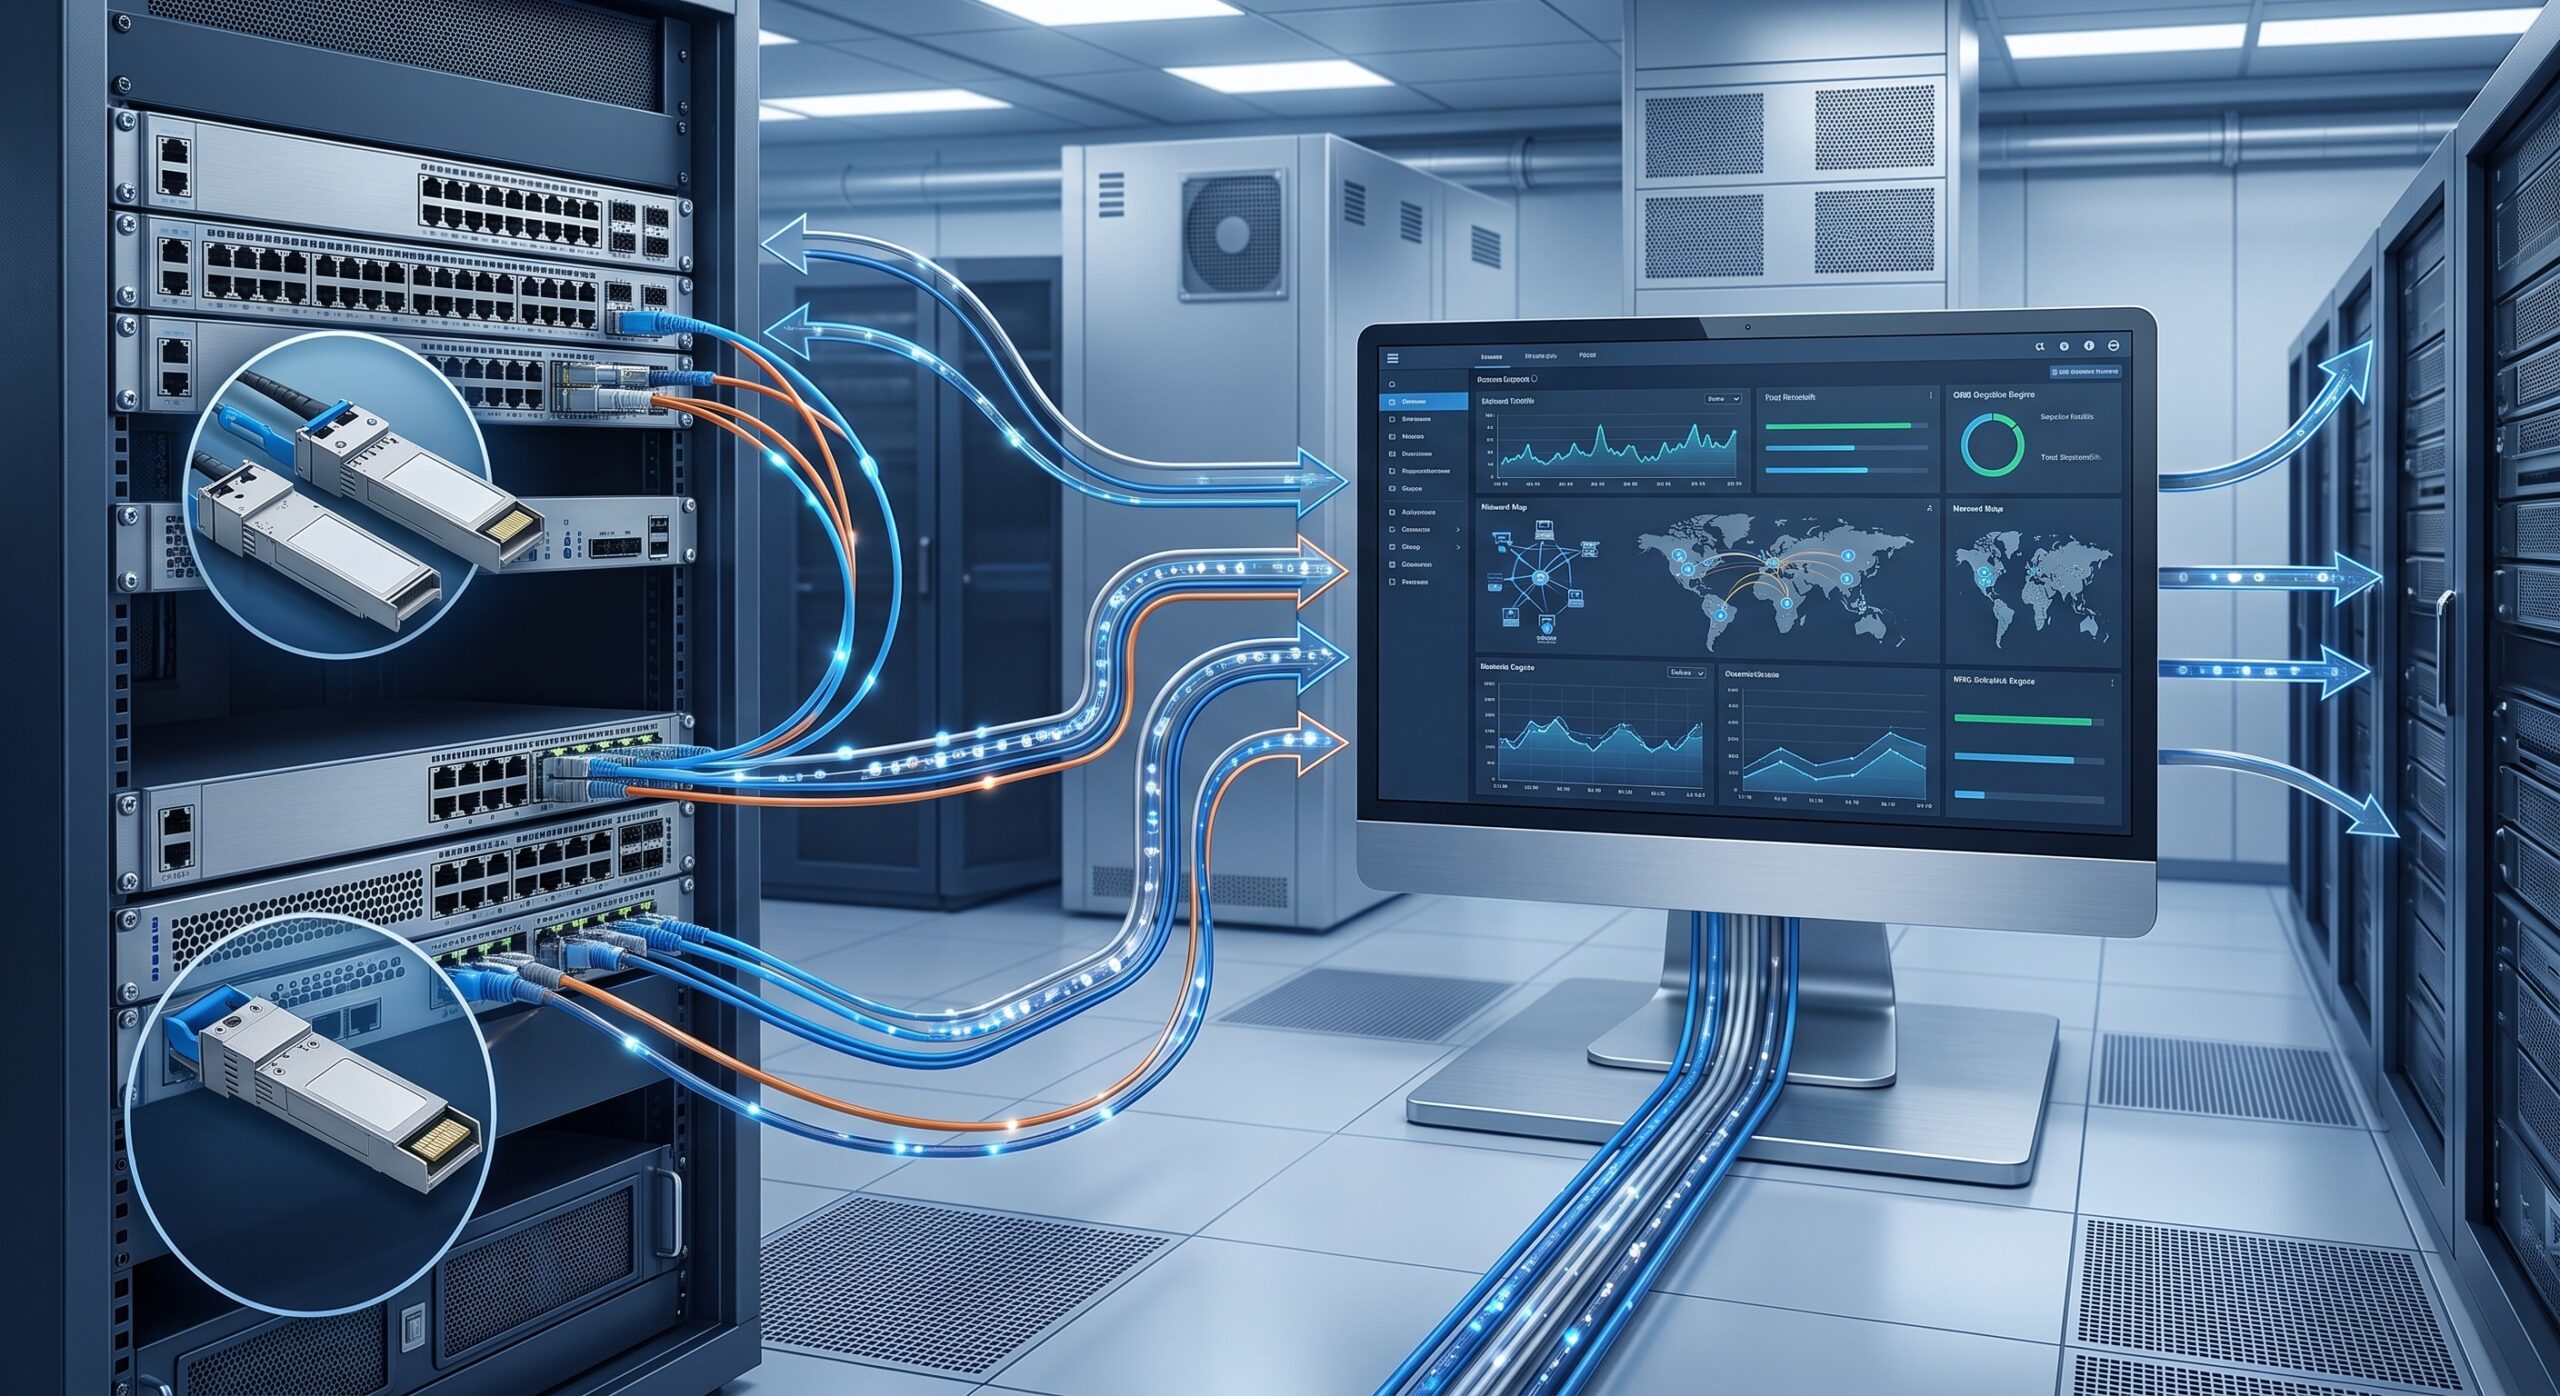
Integrating DOM into a wider network telemetry ecosystem unlocks a host of operational advantages. The following diagram illustrates a typical topology where DOM-enabled transceivers feed data into a central NMS, enabling closed-loop automation and advanced analytics.
4.1. Predictive Maintenance and Lifecycle Management
By tracking the rate of change of parameters like bias current and temperature, operators can create robust lifetime predictions. This allows for a data-driven approach to Total Cost of Ownership (TCO) optimization, moving from ‘time-based’ replacements (often leading to wasted lifespan or premature failure) to ‘condition-based’ replacements that maximize the return on hardware investment. For a large-scale datacenter with 100,000 optical transceivers, this can translate to savings of over $1 million annually by reducing unnecessary hardware churn and preventing outages.
4.2. Supply Chain Security and Anti-Counterfeiting
Authentic OEM transceivers have specific DOM parameter signatures. Deviations in calibration constants or characteristic voltage/current curves can be used as a hardware security feature to detect and quarantine counterfeit modules. This aligns with a security-first networking approach and prevents the deployment of sub-standard hardware that could introduce vulnerabilities or degrade network performance.
4.3. Fiber Plant Troubleshooting and Performance Verification
DOM data can be used to diagnose issues without deploying a technician with expensive optical time-domain reflectometers (OTDRs). For instance, a receiver reporting consistently low Rx power while a local power meter confirms an optical signal is present often points to a dirty or damaged fiber connector or a failing receiver module. This facilitates rapid remote troubleshooting, significantly reducing the Mean Time to Repair (MTTR).
5. Conclusion: The Indispensable Diagnostic Function
The Optical Transceiver DOM (DDMI) function is far more than a simple monitoring feature; it is a strategic enabler of network resilience, operational efficiency, and cost optimization. Its ability to provide real-time, granular insight into the physical layer of the network allows architects to design more robust systems and operators to proactively manage their infrastructure. As network speeds scale towards 800G and 1.6T, the role of sophisticated diagnostics like DOM will only become more critical, evolving beyond simple threshold alarms to offer more complex Machine Learning (ML) driven telemetry and automated remediation. For the B2B telecom professional, understanding and effectively deploying DOM technology is no longer optional—it is a fundamental requirement for staying ahead in a data-driven world.
Leave a comment