

Executive Overview: The Economics of Universal Fiber Access
For network architects and telecom decision-makers, the transition to Fiber-to-the-Home (FTTH) represents a critical infrastructure investment. However, many projects falter not from a lack of technical capability but from a fundamental misunderstanding of the FTTH deployment cost breakdown. The financial reality is that deployment costs are dominated by the physical layer, with civil works often consuming up to 68% of total capital expenditure . Moving beyond simple unit-price comparisons to a holistic Total Cost of Ownership (TCO) model is essential for maximizing network ROI.
This guide offers a deep technical analysis of the contributing cost factors—from the trenching metrics of the outside plant to the hidden operational expenditures of fusion splicing—providing a data-driven blueprint for optimizing network architecture and deployment strategy.

Architectural Cost Drivers: Choosing the Right PON Topology
The choice between network architectures determines the scale and distribution of the project budget. The fundamental decision lies between a Passive Optical Network (PON) architecture, which aggregates multiple customers onto a single fiber via optical splitters, and a Home-Run Fiber (HRF) architecture, which provisions a dedicated fiber back to the central office . While PON offers immediate CAPEX savings in fiber and port consumption through split ratios, the high cost of civil works often suggests that deploying higher-count fiber cables during initial trenching, even with a PON topology, is a prudent long-term strategy.
Modeling the Greenfield and Brownfield Scenarios
In greenfield developments, a centralized 1:32 split architecture is often deployed to minimize the fiber count from the Central Office (CO). However, the planning phase must account for future upgrades. The FTTH deployment cost breakdown is heavily influenced by whether the project is a greenfield (new ducts) or a brownfield (overlaying existing infrastructure). A 2008 study modeling a greenfield deployment for a town of 10,000 homes estimated the cost per home passed at approximately €1,500 ($1,600 USD), with deployment (outside and inside plant) accounting for 67% of total lifecycle costs .
The Impact of Take Rates
Network designers must design for the eventual take rate. Connecting a customer costs significantly less if done during the initial deployment phase versus a later ‘drop’ installation. While the cost per home passed in the Belgian case study was €1,500, the cost per home connected was €1,900, assuming a 100% take rate. However, if the take rate dropped to 50%, the cost per home connected rose sharply to €3,200, as the civil infrastructure costs are fixed and must be amortized over fewer subscribers .
CapEx Analysis: The Outside Plant (OSP) Dominance
The largest single factor in the FTTH deployment cost breakdown is the Outside Plant, specifically the civil works.
The Cost of Trenching
Digging is expensive. In a full-buried scenario, trenching and installation account for up to 80% of total deployment costs . This is often calculated using a Steiner tree algorithm to determine the optimal path, but the unit cost remains high. Industry-standard metrics include:
- Trenching: €20–€50 per meter .
- Permitting: Often budgeted at approximately 174 hours at $120/hour (around $20,880 per project) .
- Cable Lashing: Aerial deployment can reduce trenching costs to about $2.50 per foot .
While fiber optic cable itself is often perceived as a high-cost item, it actually only represents about 6% of the total project cost . The overwhelming priority in optimizing deployment costs is therefore to reduce excavation volume.
CapEx Analysis: Inside Plant (ISP) and Active Equipment
While civil works dominate, the active electronics and inside plant still represent significant expenditure. The central office equipment constitutes the second-largest single cost factor, averaging about 12% of the total project budget . The cost of equipment is subject to learning curves and significant volume discounts.
Key Equipment Cost References (Indicative Pricing):
- OLT Card: ~$5,400 (€5,000)
- ONT/ONTP (Customer Premises): $160–$320 (€150–€300)
- Optical Distribution Frame (ODF): ~$1,600 (€1,500)
- Fiber Cable (12 fibers): ~$1.08 per meter (€1/m) .
| Network Element | Typical Cost (Est.) | Cost Category | Lifetime Expectancy |
|---|---|---|---|
| Trenching / Civil Works (per meter) | $20 – $50 (€20 – €50) | CAPEX (OSP) | N/A (Infrastructure) |
| OLT Card (Central Office) | $5,400 (€5,000) | CAPEX (ISP) | 3–5 years (Active Optics) |
| ONT / ONT (Customer Premises) | $160 – $320 (€150 – €300) | CAPEX (CPE) | 3–5 years (Active Optics) |
| Fiber Optic Cable (12 fibers, per meter) | $1.08 (€1.00) | CAPEX (OSP) | >20 years (Passive Optics) |
| Single Fusion Splicing (Labor & Consumables per splice) | $6.00 (Average) | OPEX (Labor) | N/A (Installation Cost) |
Operational Expenditures (OpEx) and the Hidden Cost of Splicing
While CAPEX captures the headlines, OpEx drives long-term TCO. In the Belgian study, up-and-running costs (maintenance, repair, and energy over a 10-year horizon) accounted for 9% of total lifecycle costs . However, a critical operational cost often overlooked is labor during deployment and repair.
The Real Cost of Fusion Splicing
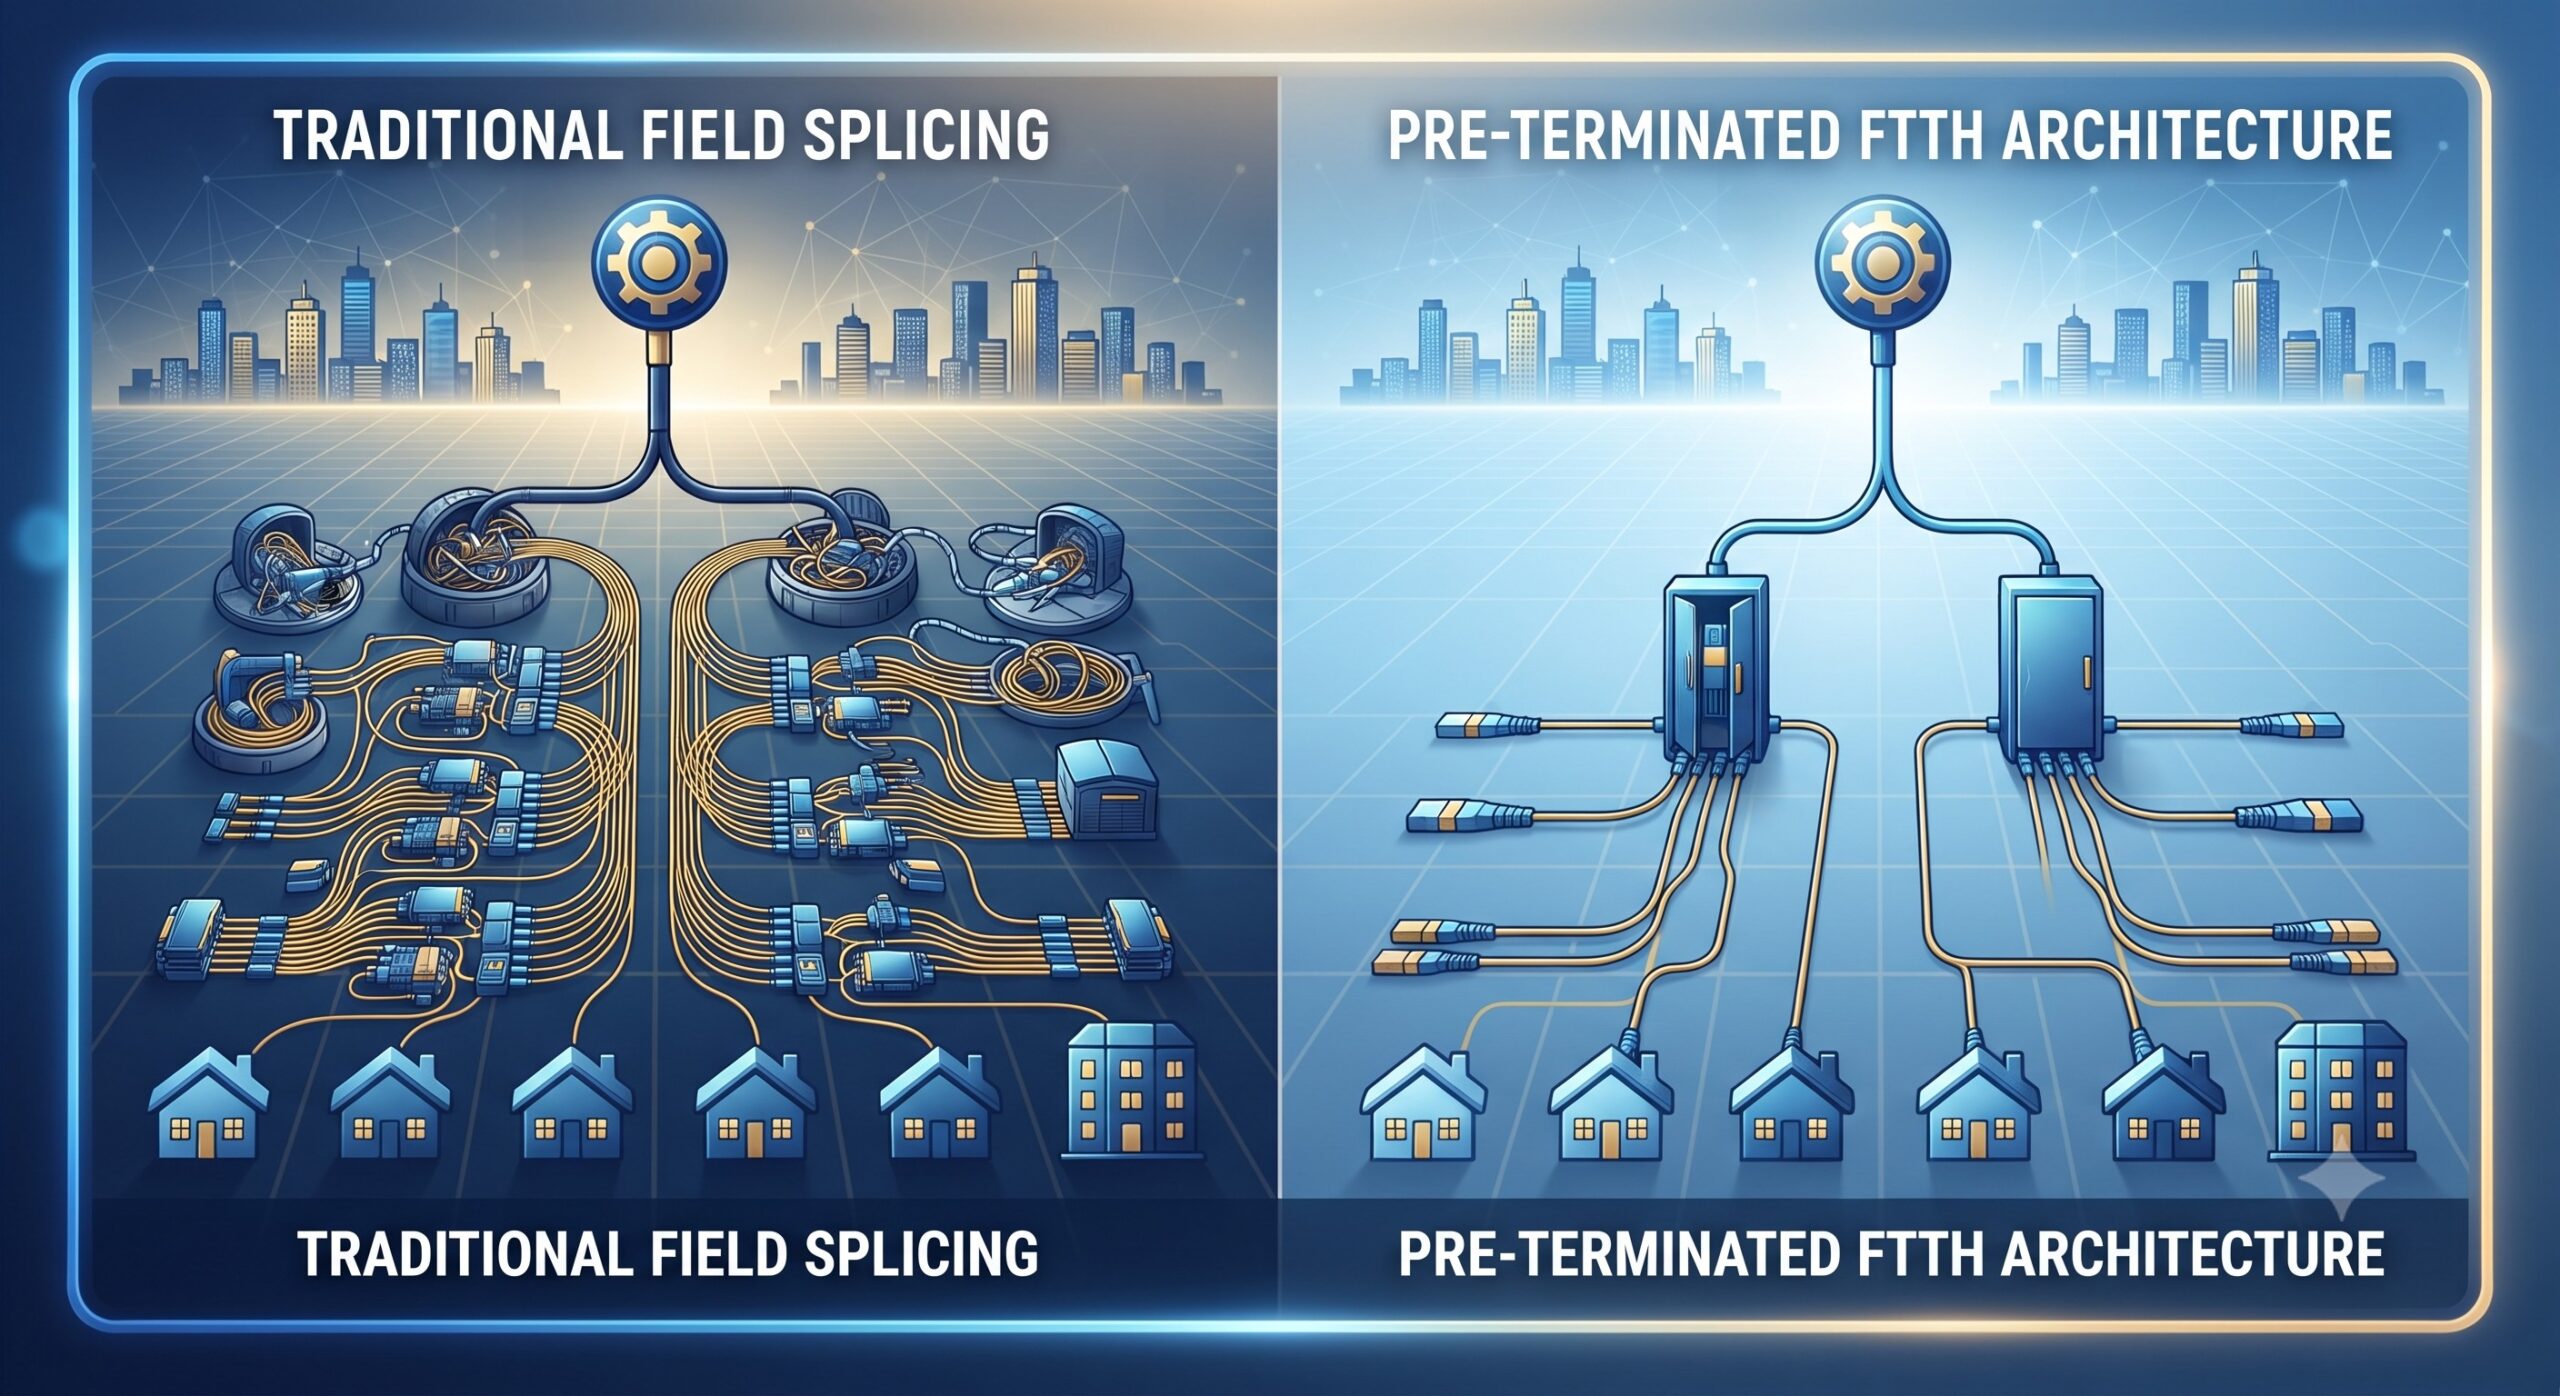
Fusion splicing requires skilled labor and time. Traditional field splicing involves preparation, fusion, and protection. A typical home requires 2–4 splice points, and each splice can take 5–7 minutes. The true cost, including setup, cleaning, and environmental factors, adds approximately $20–$27 per household in labor for splicing alone . This is a significant factor in the ‘Service Migration’ phase, which accounted for 24% of costs in the full-buried scenario .
TCO Optimization: The Pre-Terminated Advantage
A comparative financial analysis reveals that strategies using pre-terminated cabling and plug-and-play systems result in a significantly lower Total Cost of Ownership (TCO). Although pre-terminated materials carry a higher unit price, they dramatically reduce field labor and eliminate high-cost rework.
Cost Element Comparison
- Traditional Field Splicing: High labor costs, high tool rental fees, and high rework rates.
- Pre-Terminated Solution: Higher material unit price, but low labor and installation time, low consumable use, and minimal rework.
The adoption of pre-terminated solutions can yield a 20–40% reduction in overall project costs while accelerating deployment timelines and improving delivery reliability . This approach also minimizes the risk of payment deductions and project penalties.
Conclusion: A Data-Driven Strategy for FTTH Deployment
The data is clear: successful FTTH network deployment requires a strategic shift from focusing on fiber per meter and equipment unit prices to a comprehensive CapEx and OpEx lifecycle analysis.
The ‘Ultimate Guide’ to mastering the FTTH deployment cost breakdown hinges on these key financial and technical insights:
- Civil Works are the Major Cost (68%–80%): Optimize trenching routes or aggressively seek aerial/facade alternatives to slash the largest budget line item.
- Plan for Take Rates, Not Just Passed Homes: Design with future migration costs in mind; connecting a home in the initial build is dramatically cheaper than a later drop.
- Value Labor Efficiency: The hidden costs of field splicing, rework, and contractor delays are often more significant than the bill of materials. Invest in pre-terminated systems for measurable long-term ROI.
- Consider Equipment Lifetimes: When calculating the business case, factor in the 3-5 year lifetime of active optics and the 20+ year lifetime of passive mechanical infrastructure .
By applying these principles, telecom providers can ensure their architecture is not just technically superior but economically viable for the next decade of connectivity.
Leave a comment